
2022.03.06 - [데이터 분석/02. Data Processing] - [전처리] Data Transformation(데이터 변환)
[전처리] Data Transformation(데이터 변환) - 정규화
2022.03.04 - [데이터 분석/02. Data Processing] - [전처리] Types of data processing 및 데이터 클리닝 [전처리] Types of data processing 및 데이터 클리닝 Data Processing : Data Processing(데이터 전처리..
xod22.tistory.com
저번 포스팅에서 데이터 변환에 대해 공부를 해보았습니다.
이번 포스팅에서는 전처리의 세번째 종류인 Data Reduction(데이터 축소)에 대해 공부해보려고 합니다!
1. Data Cleaning(데이터 클리닝) - 결측치처리,,
2. Data Transformation(데이터 변환) - 정규화,,,등등
3. Data Reduction(데이터 축소) - 차원축소,,,
Data Reduction(데이터 축소)
데이터를 축소하는 방법에는 두가지가 있다.
1. Dimensionality reduction - 차원축소
2. Numerosity reduction - 데이터 크기 줄임
*먼저 첫번째 방법인 Dimensionality reduction에 대해 적어보겠습니다..!
Dimensionality reduction(차원축소)
1. SVD
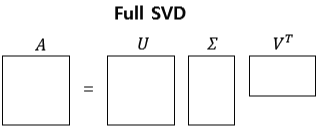
: 행렬 A를 m x m 크기인 U, m x n 크기인 ∑, n x n 크기인 Vt 로 특이값 분해(SVD)하는 것을 Full SVD라고 합니다.
하지만 Full SVD를 사용하는 경우는 드뭅니다. 실제로는 ∑의 비대각 부분과 대각 원소 중 특이값이 0인 부분을 모두 제거하고, 제거된 ∑에 대응되는 U와 V 원소도 함께 제거해 차원을 줄인 형태로 SVD를 적용합니다. 이런 방식을 Truncated SVD라고 합니다.
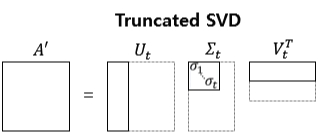
특이값을 몇개로 지정하느냐를 다르게 설정할 수 있습니다.
~실습~
1. 패키지 임포트
from numpy import array
from numpy import diag
from numpy import zeros
from scipy.linalg import svd
2. 5 by 10 matrix 생성
A=array([[1,2,3,4,5,6,7,8,9,10],[11,12,13,14,15,16,17,18,19,20],[21,22,23,24,25,26,27,28,29,30],[31,32,33,34,35,36,37,38,39,40],[51,52,53,54,55,56,57,58,59,60]])
print(A)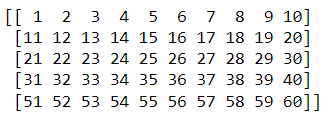
3. SVD 수행
=> SVD함수를 통해 3개의 반환값을 저장함
U, s, VT = svd(A)
4. 내적을 통해 원본행렬로 원복하기!
~s는 1차원 벡터로 저장되므로 다시 대각행렬로 복원~
# s행렬->1차원이므로 0을 포함한 대각행렬로 복원
#영행렬
smatrix = zeros((len(s), len(s)))
#대각행렬
smatrix[:len(s), :len(s)] = diag(s)
~k=4(특이값 4개로 지정)~
k=4
#k=4,3,2로 변경했을때 같은 결과!

smatrix=smatrix[:k, :k]
VT=VT[:k, :]
U=U[:,:k]

#내적
B=U.dot(smatrix.dot(VT))
print(B)
#원본 행렬과 정확하게 일치
~k=1일때~
k=1
smatrix=smatrix[:k, :k]
VT=VT[:k, :]
U=U[:,:k]

#내적
B=U.dot(smatrix.dot(VT))
print(B)
#원본행렬과 일치하지 않음!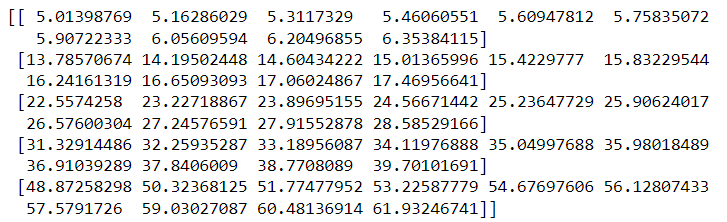
-> k=1일때는 원본행렬과 일치하지 않는 것을 확인할 수 있다..!
2. PCA
: 주성분을 계산하고 데이터를 설명하기 위해 처음 몇개의 주성분만을 사용하는 프로세스.

~실습~
iris데이터를 가져와서 PCA 주성분 분석을 수행해보겠습니다.
1. 패키지 임포트 및 데이터 불러오기
from sklearn import datasets
from mpl_toolkits.mplot3d import Axes3D
import matplotlib.pyplot as plt
import pandas as pd
iris=datasets.load_iris()
2. x,y 컬럼 따로 저장
#y데이터는 labels에 저장
labels=pd.DataFrame(iris.target)
labels.columns=['labels']

#x데이터는 data에 저장
data=pd.DataFrame(iris.data, columns=['Sepal length', 'Sepal width', 'Petal length', 'Petal width'])
3. 원데이터 plot
fig = plt.figure( figsize=(6,6))
ax = Axes3D(fig, rect=[0, 0, .95, 1], elev=48, azim=134)
ax.scatter(data['Sepal length'],data['Sepal width'],data['Petal length'],c=labels,alpha=0.5)
ax.set_xlabel('Sepal lenth')
ax.set_ylabel('Sepal width')
ax.set_zlabel('Petal length')
plt.show()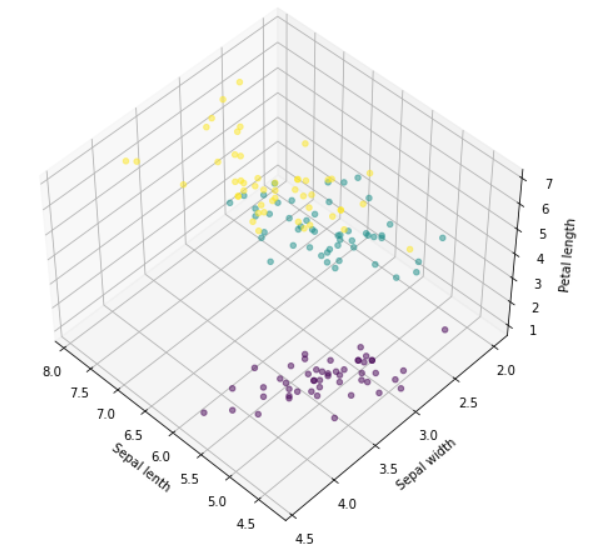
-> 데이터를 표현하기 위해서 3Dplot을 활용해야함...
4. pca 분석
~패키지 임포트~
from sklearn.decomposition import PCA
from sklearn.preprocessing import StandardScaler
from sklearn.pipeline import make_pipeline
import matplotlib.pyplot as plt#정규화
scaler=StandardScaler()
#PCA
pca=PCA()
#pipeline만듬
pipeline=make_pipeline(scaler,pca)
pipeline.fit(data)#데이터 분산에 가장 "유의한"성분이 무엇인지 확인
from sklearn.decomposition import PCA
import pandas as pd
print(pca.explained_variance_ratio_) #분산
print(pd.DataFrame(pca.components_, columns=iris.feature_names))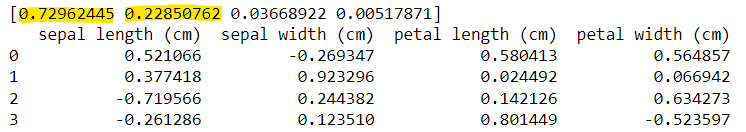
첫번째 주성분, 두번째 주성분으로 96%의 분산을 설명할 수 있음!
각 컬럼별 기여도(?)를 확인하면 위의 표와 같다..!
5. 분산 plotting 해보기
features=range(pca.n_components_)
plt.bar(features, pca.explained_variance_)
plt.xlabel('PCA feature')
plt.ylabel('variance')
plt.xticks(features)
plt.show()
# 두개의 컴포넌트로 총 96%를 설명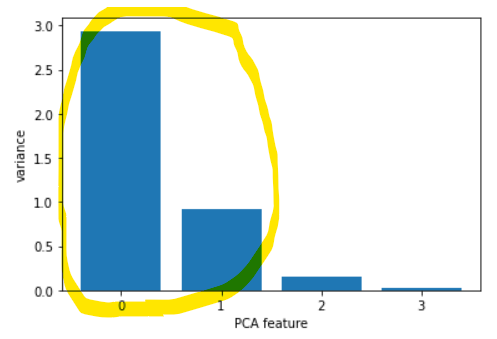
= > 두개의 주성분으로 96%를 설명하는 것을 확인
6. PCA로 두개의 주성분으로 축소된 데이터 plot
# 원본 데이터의 특성 4개를 주성분 2개로 축소해서 나타낼 수 있음
model=PCA(n_components=2)
pca_features=model.fit_transform(data)

xf=pca_features[:,0]
yf=pca_features[:,1]
plt.scatter(xf, yf, c=iris.target);
plt.show();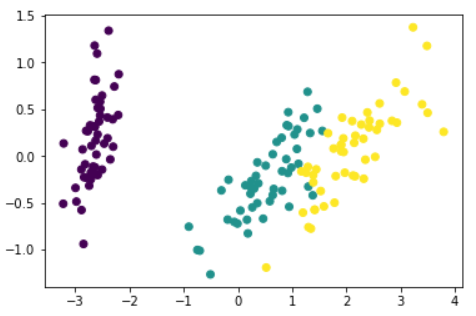
원 데이터는 3D plot을 이용하여 plotting되었지만 pca로 차원을 축소한 후에 간단하게 plot할 수 있다!
'🔍 데이터 분석 > 02. Data Processing' 카테고리의 다른 글
| [전처리] 네이버 영화 평점 크롤링 데이터 - Preprocessing (0) | 2022.03.24 |
|---|---|
| [전처리] Data Reduction(데이터 축소) - 수치적 축소 (0) | 2022.03.08 |
| [전처리] Data Transformation(데이터 변환) - 새로운 속성 만들기 (0) | 2022.03.06 |
| [전처리] Data Transformation(데이터 변환) - 정규화 (0) | 2022.03.06 |
| [전처리] Types of data processing 및 데이터 클리닝 (0) | 2022.03.04 |